In this article, you’ll be diving into an introduction to how packers work, some tips to unpack, and two walkthroughs showing off how i usually deal with custom packers.

How do packers work?
Packers generally have three types: Compressors, Crypters and Protectors. A Compressor, as its name says, compress the size of the desired file, or in other words, it squeezes a file into their own unpacker process. A Crypter encrypts the payload, executes it in memory at runtime (with an option to drop the final payload on disk), and aims to evade detection from AV/EDR software, without the need of compressing the file. Protector perform both packing and encryption of their payload. Additionally, they employ various anti-debugging and anti-reversing techniques to make the entire unpacking process challenging for reverse engineers.
The main part of a packer is its stub, which is responsible for the unpacking routine. So, when a file is inputed, it basically generates a stub with the payload inside it.
Internally in the stub, there are 3 main forms of storing the encrypted payload:
- On the file’s overlay
- On the file’s last section
- On a large encoded string, which is decoded and decrypted in runtime
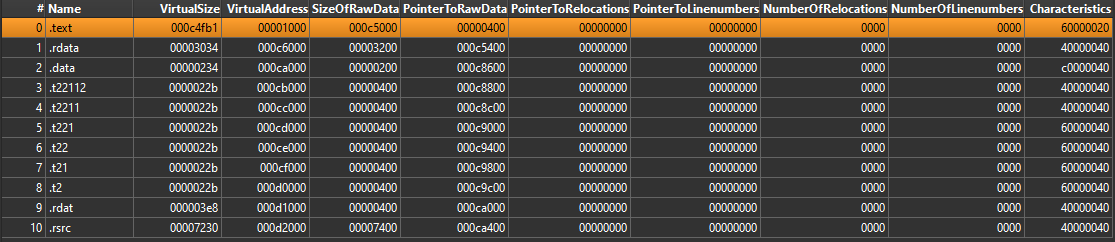
A way to identify the section which contains the packed file is looking for its size. If the raw size is small or set to zero, and the virtual size is large enough to store a PE or shellcode, it may likely be our target.
In a Crypter, the packer’s stub procedure is responsible for decrypting the payload, then running it in one of two regions: inside their own process, or in a remote process.
Running inside their own process is done, in simple terms, by allocating memory, writing data to the allocated memory, adjusting its protection and setting the EIP register to point to that specific location. Also, some custom packers will replace their on .text section with the packed payload.
The address where the packed payload starts executing is also known as OEP, Original Entry Point.
When the execution is within the address space of another process, it typically relies on some form of injection technique, like process hollowing. Commonly creating a child process (which may appear legitimate in some instances) and running the payload on it.
But how does the stub figure out where the payload begins and ends?
The payload typically includes some kind of marker (distinction bytes), which identifies the payload’s starting and ending bytes. Recognizing this, we can make those markers an signature for the packer.
Moreover, the presence of polymorphic packers is notable, as they tend to generate entirely new stubs even for the same input. This dynamic behavior enhances evasion capabilities, making it challenging for signature-based detection methods to identify and combat the packed payloads.
However, given the scope of this article, I won’t delve into this type of packer.
Identifying packing
Packing identification is not a exact science, instead, it consists of verifying a number of strikes, which lead us to assume that the file is packed. The main strikes are:
- Entropy (7.0+)
- Non-standard section names
- Executable sections that are not .text/.code
- Lack of imports
- Lack of functionality-specific imports (A windows ransomware who doesn’t import any WinCrypt API is likely packed for example).
- Sections with the raw size zeroed, but a large virtual size.
- Missing network-related APIs
- Presence of an overlay
- Large .rsrc section (Combined with a call to LoadResource)
- The code itselfs, when opening into a disassembler, looks weird.
These are just a few strikes i use myself, obviously there are plenty more out there.
Unpacking techniques
As well as identifying it, unpacking isn’t a exact science, the approach we take can vary according to the packer we are dealing to.
I usually stick with three main approaches: breakpoints on specific APIs, break on module loading or automated unpacking.
Also, the malware could have several unpacking stages, so never assume a sample is unpacked until analyzing it further.
Breakpoints on specific APIs
These are done by placing breakpoint on memory-related APIs. Examining their params and return values will eventually bring us to interesting memory regions.
The APIs are usually:
- CreateProcessInternalW( )
- VirtualAlloc()
- VirtualAllocEx()
- VirtualProtect() / ZwProtectVirtualMemory()
- WriteProcessMemory() / NtWriteProcessMemory()
- ResumeThread() / NtResumeThread()
- CryptDecrypt() / RtlDecompressBuffer()
- NtCreateSection() + MapViewOfSection() / ZwMapViewOfSection()
- UnmapViewOfSection() / ZwUnmapViewOfSection()
- NtWriteVirtualMemory()
- NtReadVirtualMemory()
- CreateProcessInternalW
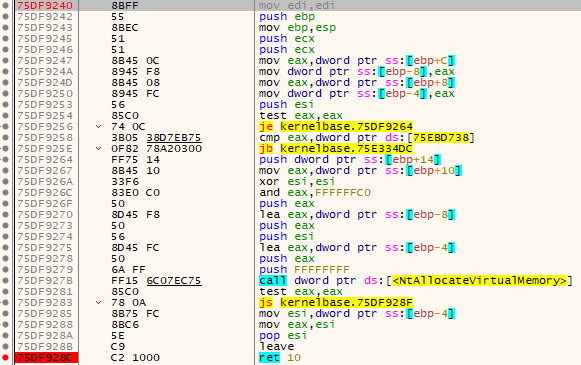
My main targets here is VirtualAlloc, VirtualProtect, CreateProcessInternalW and ResumeThread. On VirtualAlloc, we put a breakpoint on its exit point, more precisely on the “ret 10” instruction, then following eax on dump. On VirtualProtect, we check what address is into ecx, following it on memory dump. On the latter ones, we follow the address where its marked to start the new process/thread, and dump it.
Also, it is a good practice to put breakpoints on known anti-debug APIs, so we can bypass them to continue our unpacking.
Break on module loading
This method is quite straight-forward: halt the debugger for every loaded DLL, examine the binary’s memory map, and look for both RWX and RW segments, as packers commonly load modules into RW segments and later modify permissions to RWX.
We can even use volatility for this purpose. Run the malware and take a system image. Within vol.py, use memory.vmem procdump to search for interesting segments and memory.vmem impscan to fix the IAT.
Automated unpacking
This approach consists by using some tool to extract the packed payload. it is a core decision when dealing with deadlines.
Some of them are:
- UnpacMe: https://www.unpac.me/
- pe-sieve: https://github.com/hasherezade/pe-sieve
- hollows-hunter: https://github.com/hasherezade/hollows_hunter
- Shinigami: https://github.com/buzzer-re/Shinigami
Don’t forget that these tools usually run the malware to unpack it, so use it on a isolated environment.
However, when none of these methods works properly, it becomes crucial to delve into the intricacies of the packer’s procedure.
Therefore, this article is committed to unveiling the inner workings of a custom packer. Our objective is to understand its procedures and extract the final payload.
Custom Packers
Most malwares makes use of known packers, like UPX, so it is quite trivial to unpack its payload. Although, in some cases, the malware authors use their own packers, which is quite difficult to reverse engineer at glance, yet there are some approaches which make this process easy for us.
First, the main purpose of the packer is to unpack something. Therefore, it can be understood that a considerable part of the code we come across involves complex arithmetic, primarily aiding the unpacking procedure to uncover the payload. Being aware of this, we end up not really interested in those arithmetic’s.
Second, there will be frequent indirect calls, like: a call to a register/stack variables, a push and then a ret instruction, jump to registers/stack variables. Understanding that, it is easier to track the packer’s control-flow and getting into the final payload.
Third and last, we will be using static and dynamic analysis, so we can resolve those indirect calls and follow along with the static disassembler.
Many custom packers will try, in some manner, to deflect the analyst’s attention, so keep in mind that the unpacking code is one-way, meaning that it has no intention to return back from where it is called.
Sample #1
sha256:5617238b8d3b232f0743258b89720bb04d941278253e841ee9cbf863d0985c32
The sample is a Simda Trojan, which is described by Microsoft as: “a multi-component trojan that downloads and executes arbitrary files. These files may include additional malware.”
Simda is also known for using customized packers, which can be pretty evasive and mislead our static analysis.
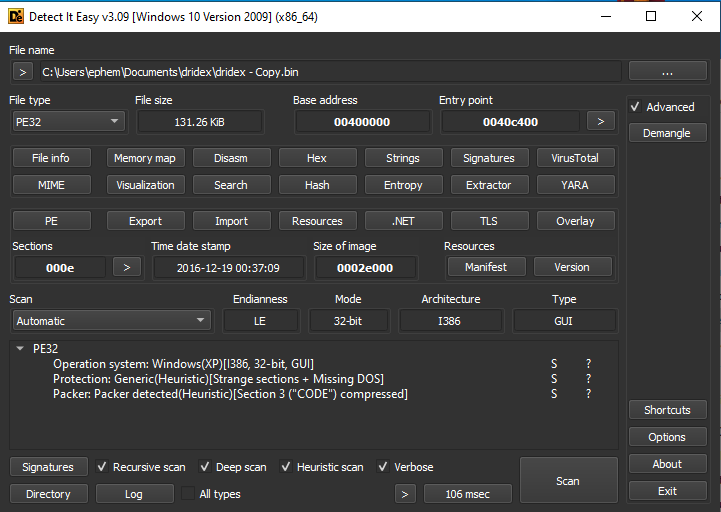
The sample is a 32-bit executable compiled with Microsoft MSVC within Visual Studio 2008:
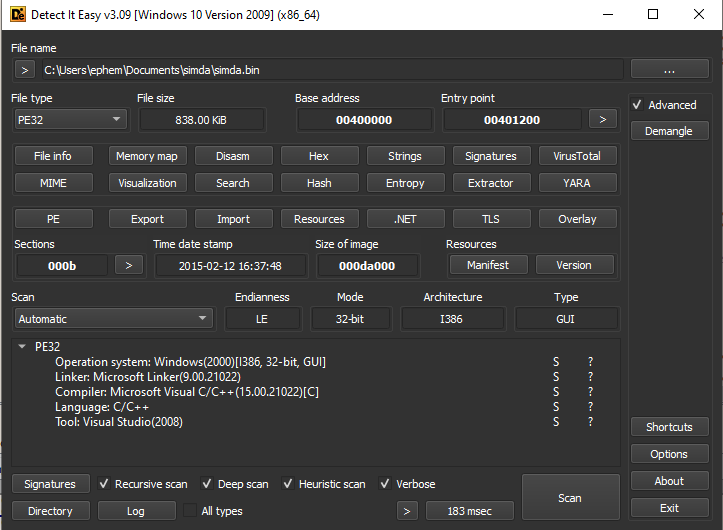
We can confirm it is packed by:
- Misleading strings
- Non-standard section names
- Lack of imports
- Lack of networking APIs
Now we have two approaches to this sample, the naive and the savvy.
Naive approach
The naive approach is using a debugger. Although it can be quicker, I call this a “naive” approach because we don’t quite understand how is the unpacking procedure, so in a detection engineering context, it could not be the best approach.
This approach consists of putting breakpoint on memory-related APIs and looking for interesting memory dumps. I’ll be using x64dbg for this purpose.
After reaching the entrypoint breakpoint, start placing our API breakpoints. Go to VirtualAlloc (Ctrl + G) and place a breakpoint on its exit point (ret 10).
After it, place breakpoints on: VirtualProtect, CreateProcessInternalW, CreateThread, ResumeThread, IsDebuggerPresent and FindWindowA (bp [API_name]).
Resume its execution (F9) and VirtualAlloc will be hit, follow EAX on dump 1. After it, VirtualProtect will be hit several times (21 times!)
However, as the reader might have noticed, most of the VirtualProtect calls are targeting the address range of ~0x0400000, which can possibly be a .text replacement
None of them is relevant for us in this approach, just look at dump 1 after the first call to VirtualProtect and the reader will see our unpacked PE.
But remember, do not assume the first extraction is the final payload, packers can have several stages.
To confirm it is the final payload, open it on DiE, there are plenty of indicators:
- Encrypted strings
- anti-analysis-related strings
- Register keys paths
- Standard section names
- low entropy
And obviously, open it on your favorite disassembler to assure yourself.
The reader may have noticed that we do not understood nothing of what was going on the unpacking phase. That’s why even though this approach is quicker, when it fails, you need to have a backup, which is deep diving into the packer’s code!
Savvy approach
This approach consists of diving into the packer’s code and understanding the core details of it. I call it a “savvy” approach because we really get to know what’s going on, so it will be easier to write detections based on its behavior.
Initially, it’s crucial to keep two key points in mind when examining packers. First, most of the code we’ll see, is related to the unpacking procedure and complex arithmetic, so it isn’t really needed to fully reverse it. Second, indirect calls are expected, often guiding us towards the unpacked code.
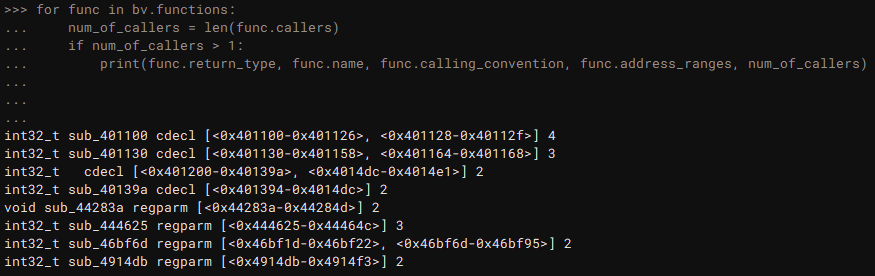
Opening it on Binary Ninja, we can see a lot of functions (3294 to be more precise), but most of them aren’t never really called, hence we can make a quick script using the Binary Ninja API to show which of them are actually called anytime on the program’s lifetime:
To activate the python console, press the backtick key ( ` )
for func in bv.functions:
	num_of_callers = len(func.callers)
	if num_of_callers > 1:
		print(func.return_type, func.name, func.calling_convention, func.start, num_of_callers)
which returns:
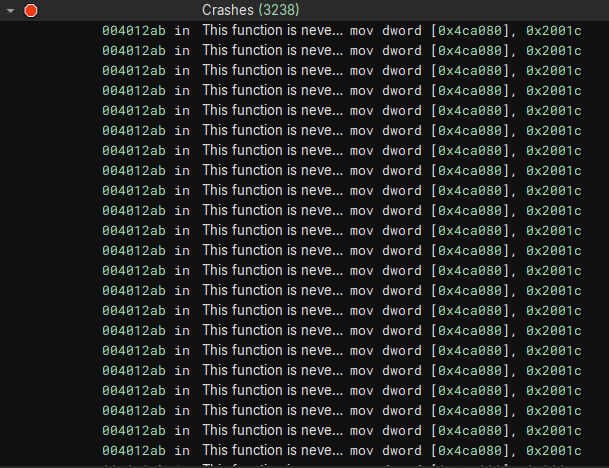
After that, for the sake of our analysis, we can tag all the other which aren’t called anytime in the program’s lifetime, so we don’t spend time reversing it.
for func in bv.functions:
	num_of_callers = len(func.callers)
	if num_of_callers < 1:
		func.add_tag("Crashes", "This function is never called", here)
		func.set_comment_at(here, "Unused")
Ending up with 3238 functions who are never called.
Now, we can start our reverse engineering.
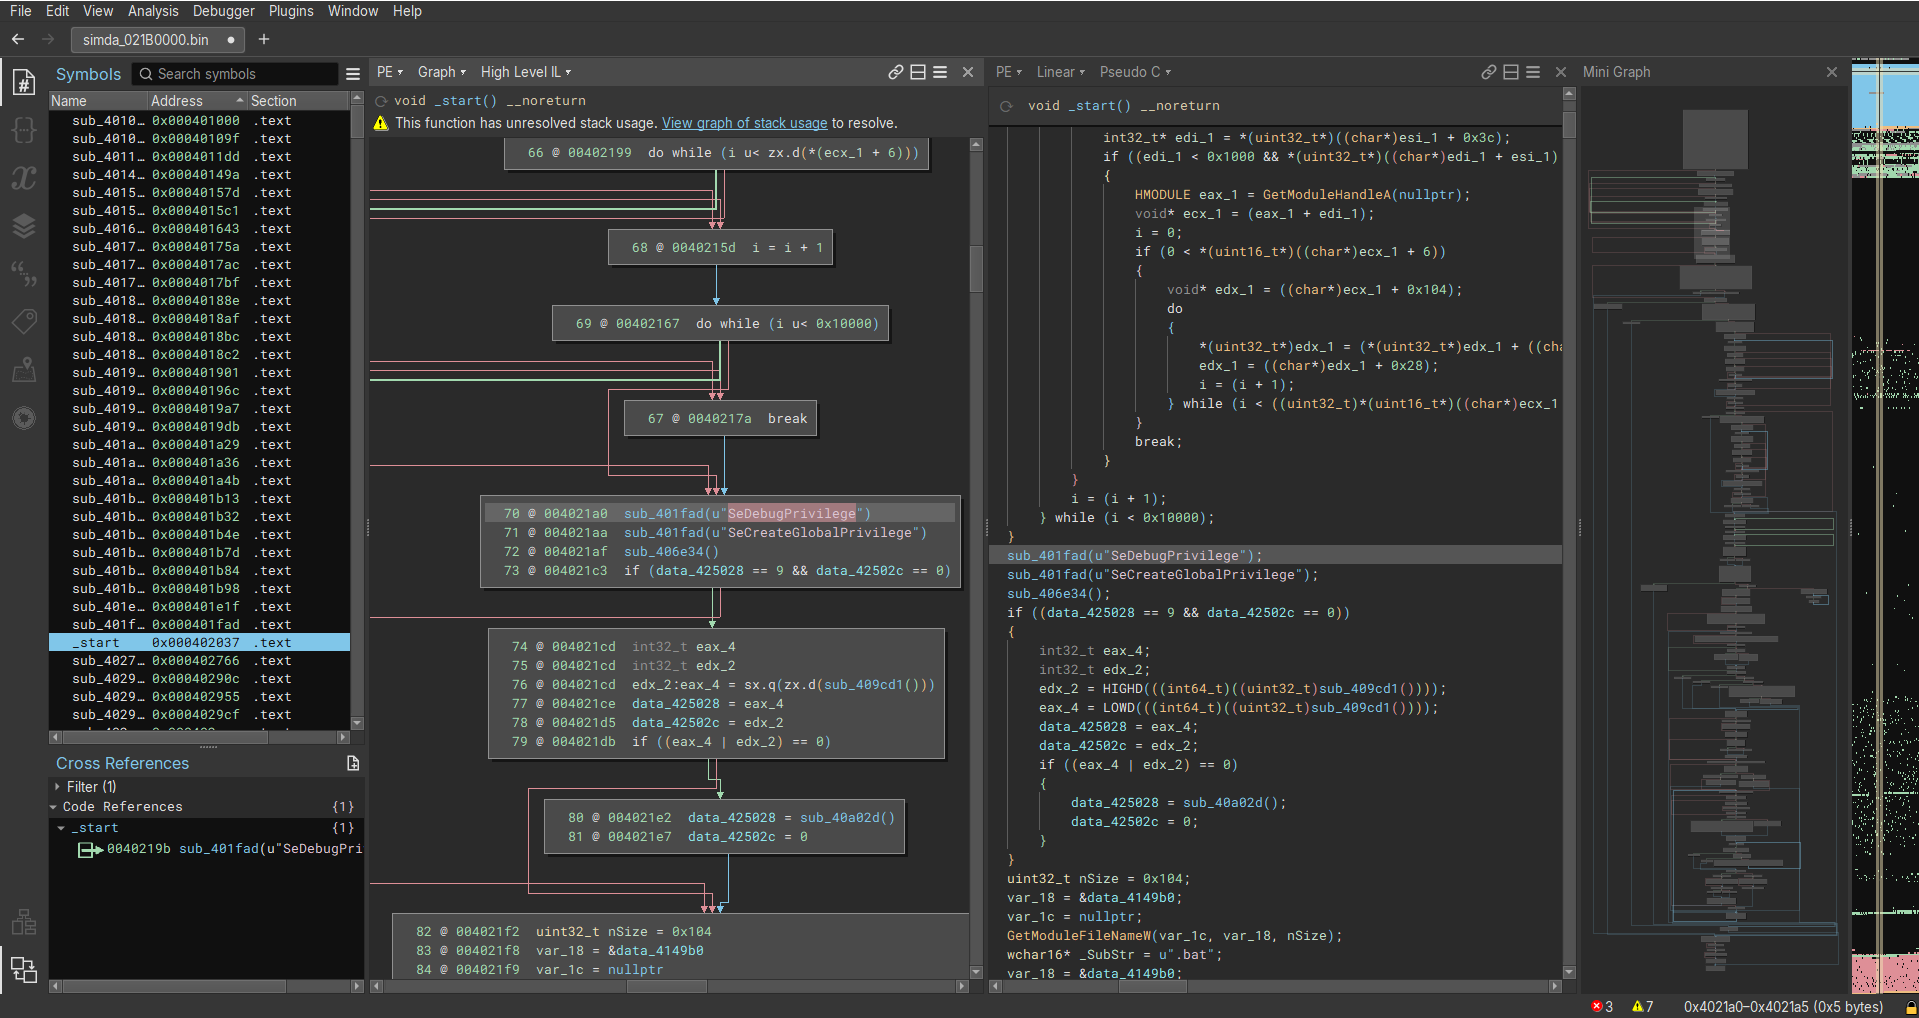
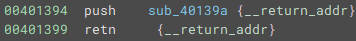
At program’s entrypoint, scroll all the way down to the function’s end addresses, the reader will see a common obfuscation technique, which pushes an address to the stack, and immediately returns, leading EIP to be set at that address.
Following sub_40139a, we will again encounter that type of obfuscation, which eventually will lead us to the address 004013a6.
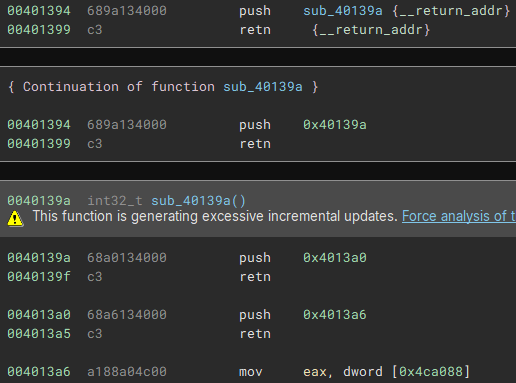
This sub does not do anything relevant to us. There are many calls to sub_401100, which is junk code. On the function’s epilogue, the reader will notice that eax register is being pushed onto the stack, then, the function returns. This follows the same technique we saw before.
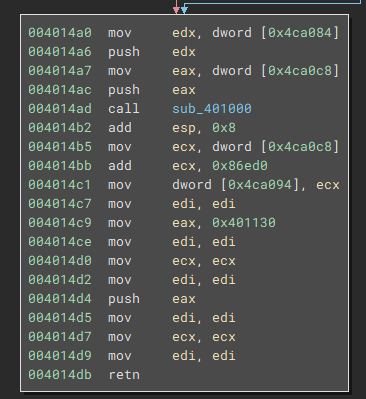
We can spot the address 0x401130 being loaded into eax. Following that address, sub_401130 comes into place:
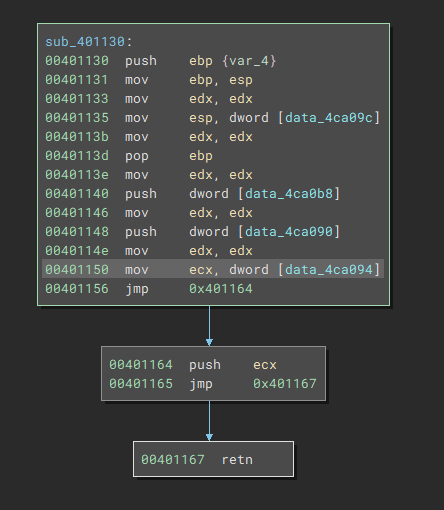
As we saw before, ecx is being pushed onto stack, then the function returns. If we go back a few instructions, data_4ca094 is being loaded into ecx. Looking inside data_4ca094, it is empty, so we can assume that something is loaded inside it in runtime.

How do we discover what is loaded at this location? Simple, we put a breakpoint on this address, and check it out!
Yet, hold on, before getting our hands into a debugger, lets wrap up what’s happening until now.
Come back to the binary’s entrypoint. The reader will notice that the function which loads the content from data_4ca094 inside ecx (sub_401130) is called plenty of times. Knowing that, we can assume that each block of code tries to setup data_4ca094, then, if it is succesfully set up, sub_401130 is called.
If the reader looks closely, a call to LoadCursorA is made, which loads or retrieves a handle to a cursor. The point is, a cursor can also be a bitmap, so the payload is possibly stored on a bitmap format.
Open the binary in x64dbg and put a breakpoint in push ecx (00401164):

Once stopping, check what’s inside ecx. The address 006e6ed0 (might be different for you) is loaded onto ecx, so the next stage is at that address.
Looking for this address in our disassemble, we soon notice that it doesn’t exists. This means that what’s on this address is being loaded in runtime (as we stated before), more lilkely to be a shellcode.
The next step here is dumping the memory segment which the address within ecx is at, and opening it on a new disassemble session.
Following ecx on Memory Map, right click and press “Dump Memory to File”. Don’t forget to keep the segment’s base address on the saved dump name, it might be useful in the future.

Notice that this memory range is marked as ERW, which is a good indicator of the unpacked code, but not absolute.
Opening the shellcode on Binary Ninja, try to go (g) to the address that was loaded into ecx, it does not exist!
This happens because, on the debugger, we are dealing with virtual addresses, and on Binary Ninja, raw addresses. To overcome this situation, we need to calculate what is the offset of the address within ecx, so we can follow along with our disassembler. The calculation is simple:
- RVA - VA = offset
So, 006e6ed0 - 00660000 = 00086ed0.
Going to this offset (g), we will soon again encounter the same obfuscation technique, with push & ret instructions.
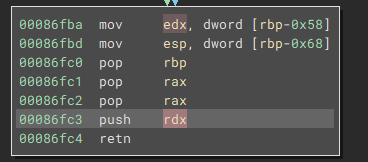
To follow along, put a breakpoint on push rdx instruction.
Remember, on the disassembler we are dealing with raw offsets, so we need to convert it into virtual addresses:
- 00086fc3 + 660000 = 6e6cf3
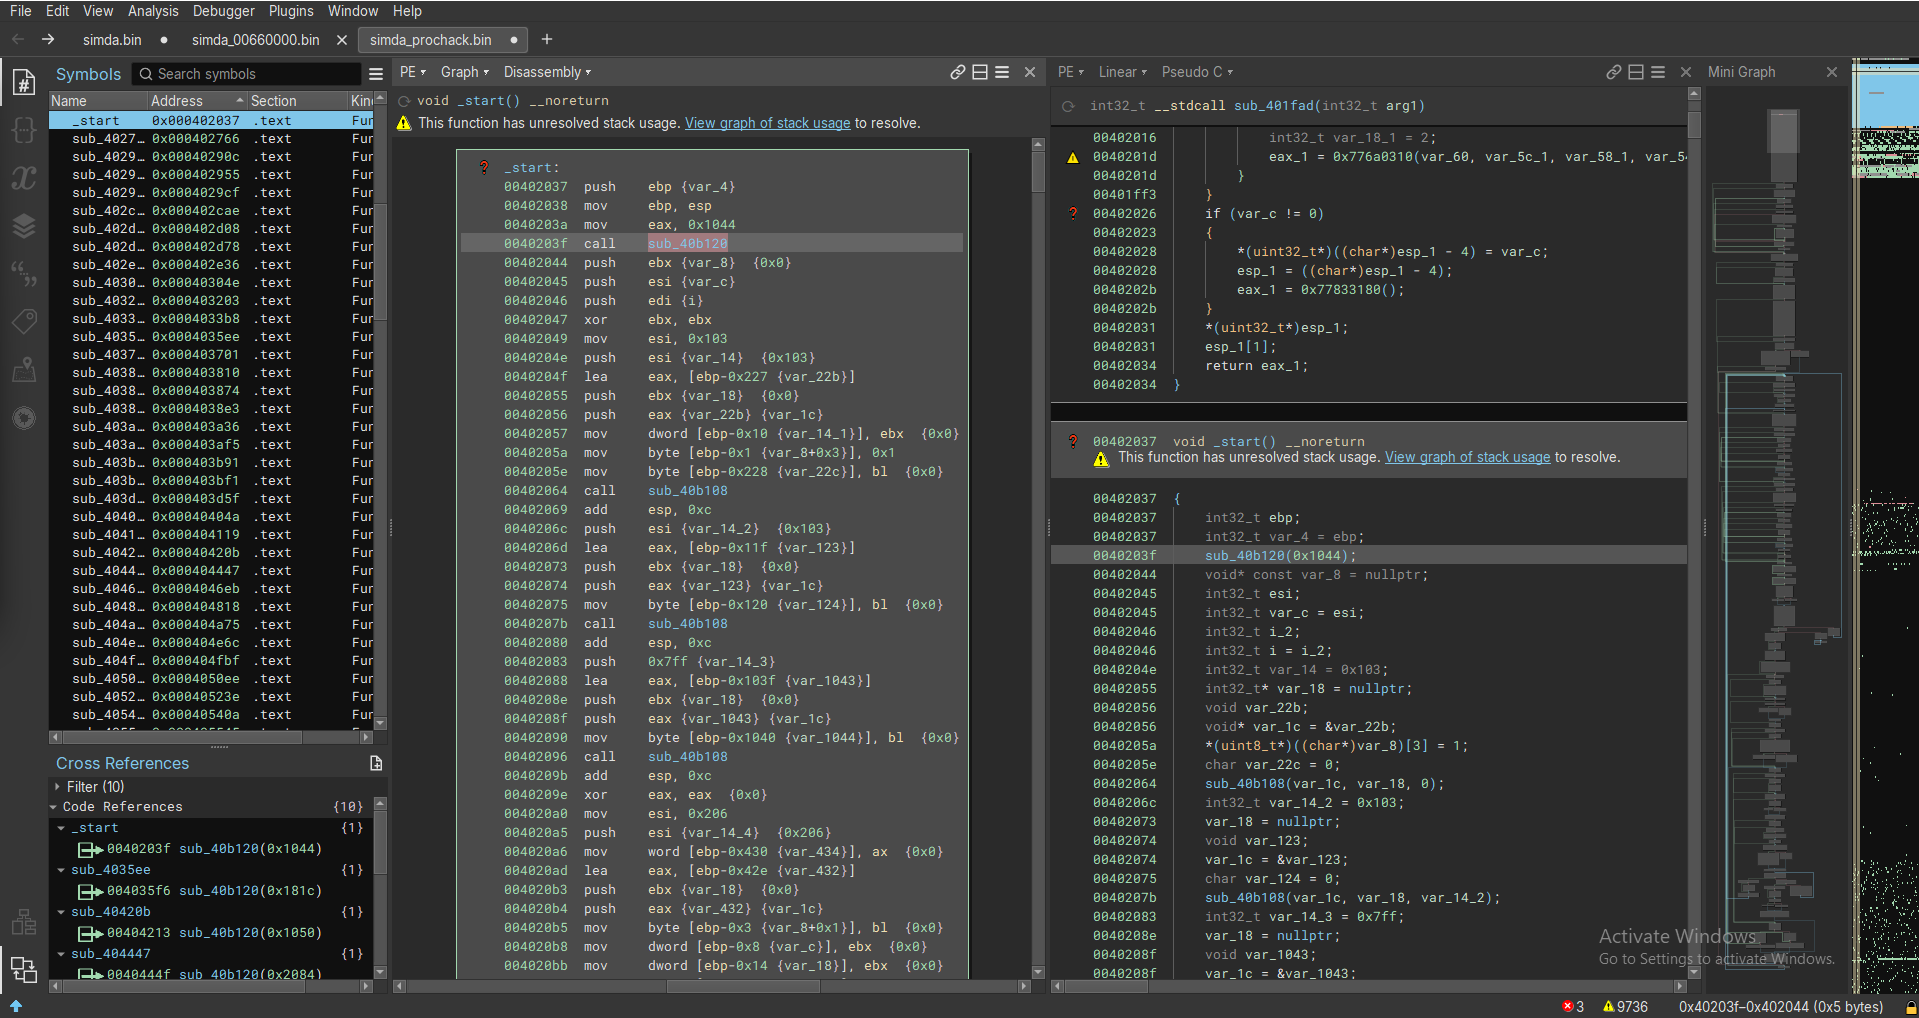
Run (F9), and we can see that the address 0042037 is loaded into edx. The address 0042037 is on the binary’s .text section, this can lead us to believe that it is being replaced in runtime (as we were suspicious before).
In that particular case, dump the whole binary from memory again. Although, we’ll see that it does not apply to every .text replacement, sometimes it is just a shellcode, so the reader need to dump only the address range of the .text itself.
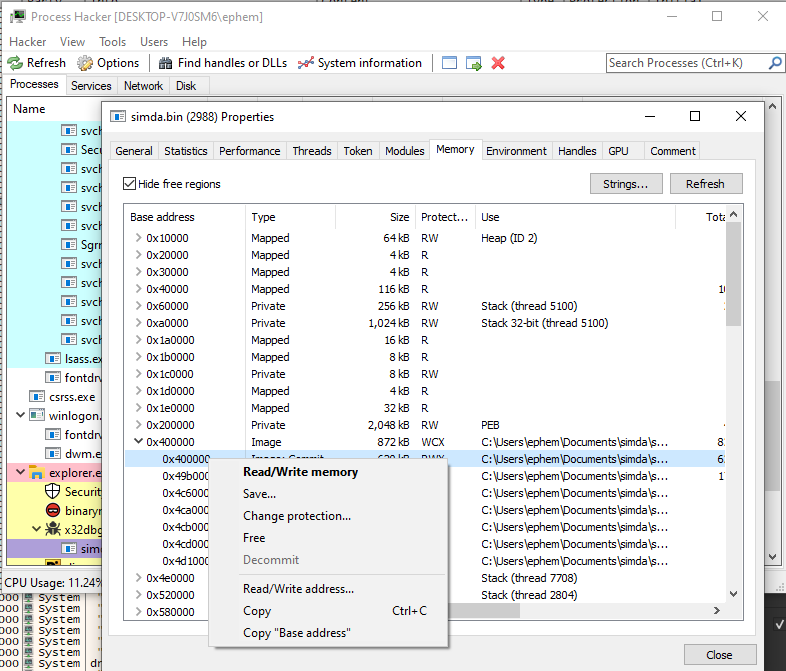
Also, i had a better result dumping it from Process Hacker instead of x64dbg. The process is simple:
Right click on the malware’s process, go to Properties, Memory tab, Open the address at 0x400000, Right click on 0x400000, press Save…
To confirm it, open both unpacked samples (the naive one and the savvy one) on your disassembly, and compare the results, you will see that they are equal.
Sample #2
sha256:034e193f88a93ebb4ac8ca8da5b3b1429600ef04e5c124457ce0bc1830bae558
This is a Dridex sample, which is stated by malpedia as: “an evasive, information-stealing malware variant; its goal is to acquire as many credentials as possible and return them via an encrypted tunnel to a Command-and-Control (C&C) server.”
Dridex is also known for its sophisticated TTPs, which includes the unpacking process we are dealing today.
The binary is a 32-bit executable.
To assure it is packed, let’s list some of the strikes:
- Only 3 imported DLLs (msvcrt.dll, pdh,dll, KERNEL32.dll).
- Lacks of network APIs.
- Non-standard section names (y2A, .3cBjO, CONST).
- Does not have any meaningful string.
- Entropy of 6.9
Also, looking at it on Binary Ninja:
And due to the author’s sanity, we will be doing the navvy approach only.
Navvy approach
I won’t be delaying any more practical time, at this point the reader should have all the necessary knowledge to follow along.
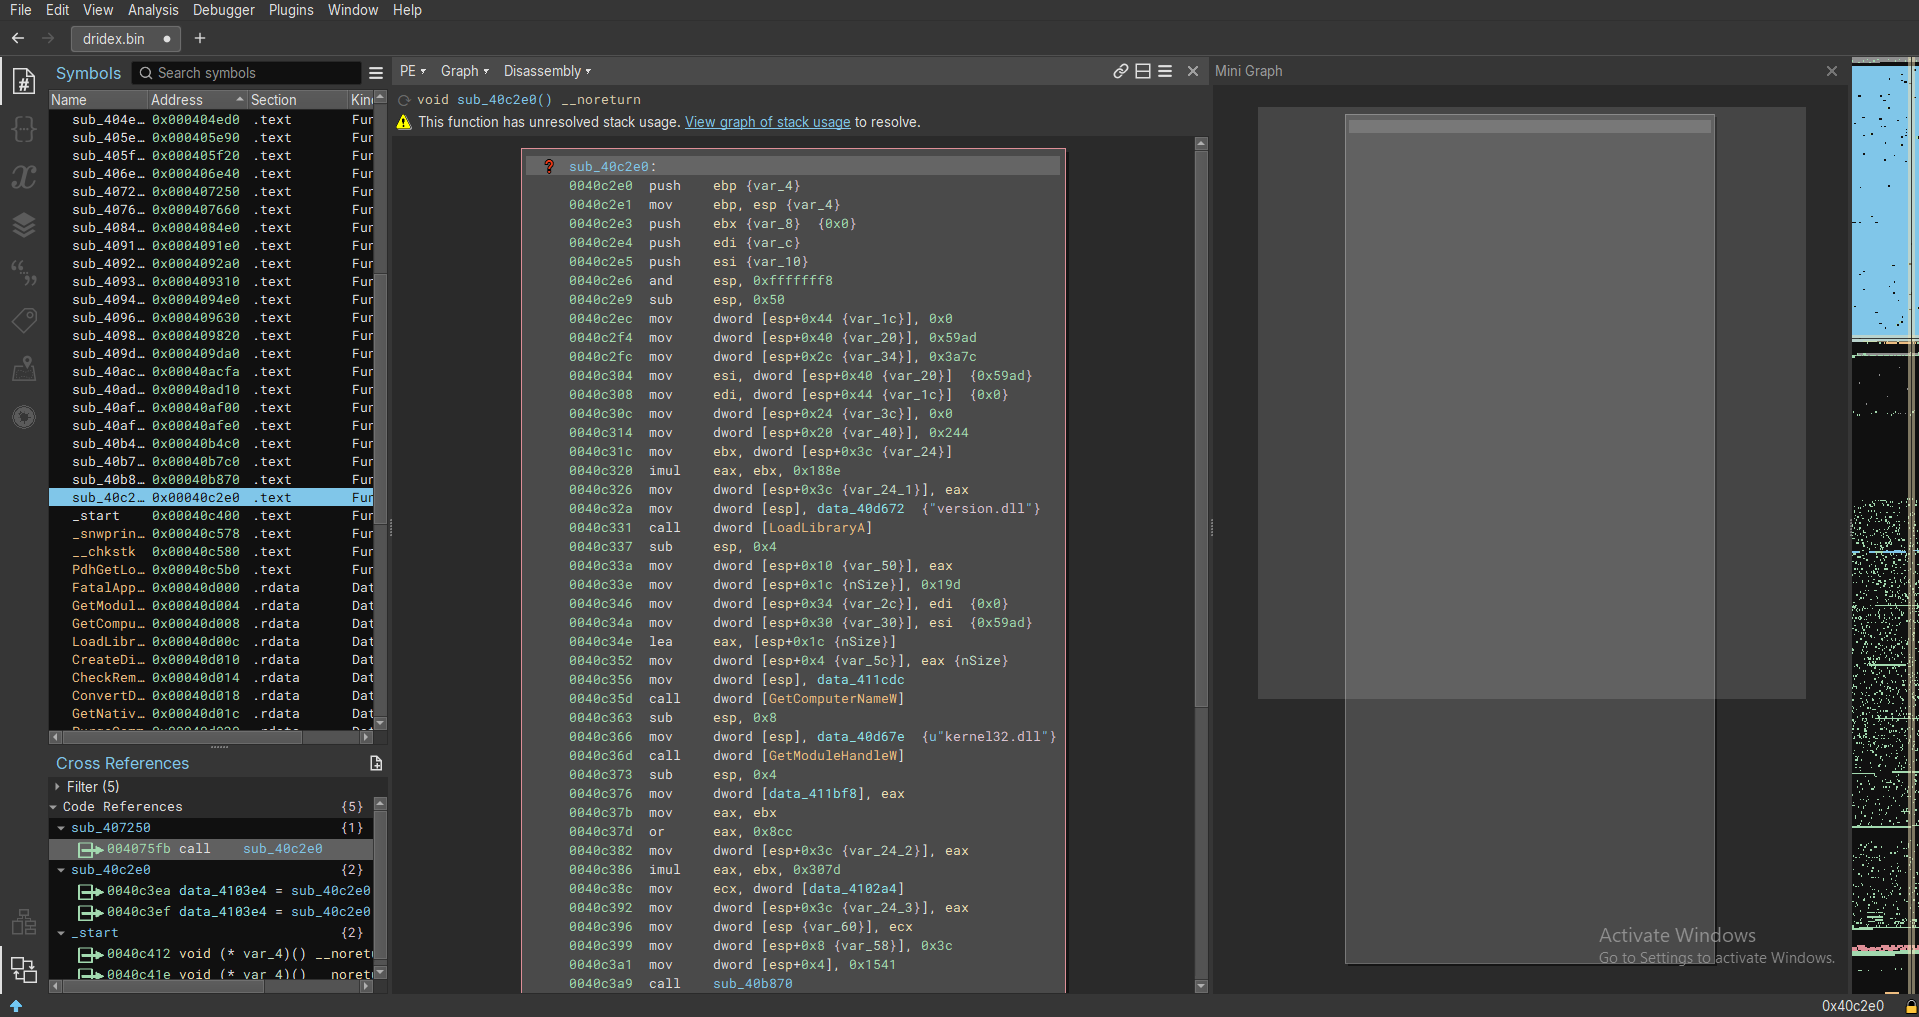
As we open the PE on Binary Ninja, we soon notice the same obfuscation technique used by the previous sample:
Following eax (sub_40c2e0), we can see that it does significant stuff. It loads version.dll, gets a handle to kernel32.dll and calls other subroutines:
- sub_40b870 - walks kernel32.dll and stores it onto a Atom
- sub_40b4c0 - manipulates the previous atom
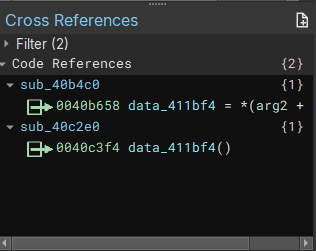
In its epilogue, it makes a call to data_411bf4, which is populated at runtime. If the reader check the code references to that data location, it will encounter the eax register being moved into it. Place a breakpoint on that instruction.
Hitting that address, step over and then follow that location on memory dump. The reader will soon notice, by its bytes, that it is code-related.
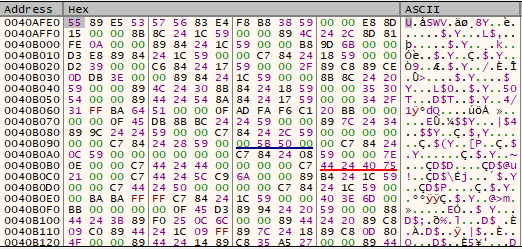
- Sequence of 5x… - pushes or pops
- C7[84/44]24 - mov value to stack
To confirm it, place a breakpoint on the call to data_411bf4. The reader will see that what’s being called is the same content as we’ve saw before.
Another interesting point is the ud2 instruction.

This instruction means that the disassembler wasn’t able to disassemble the instructions after it, meaning that the code doesn’t aim to return after this call. This is also a good indicator of we being on the right track to unpack it.
Following the call, we will get into the address 0x0040afe0, which exists in our disassemble and looks like this:
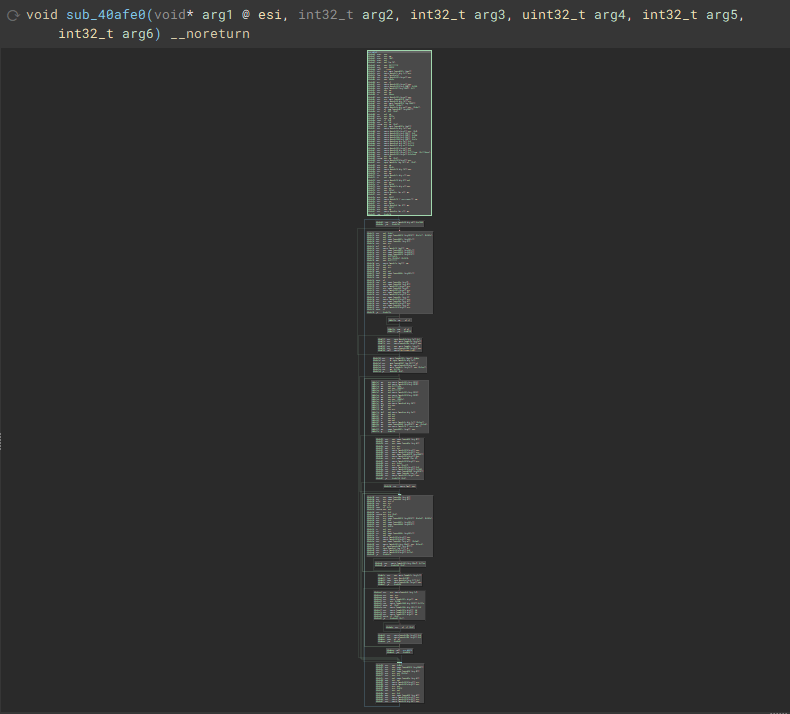
Now it gets trickier, if the reader go straight to the end of this subroutine, it won’t encounter any indirect call or any clue that leads us to the next stage of the unpacking procedure.
I encourage the reader to look deep into this function and finding the next stage by its own before continuing.
This subroutine makes only 3 calls, which 2 of them are useless to us. So, the only option is the call to sub_409820.
Following sub_409820, we can see a complex subroutine that make a lot of calls. On this situation, don’t get away from your focus, trying to understand what each subroutine does will only takes to a infinite rabbit hole. My strategy here was searching for indirect calls on those subroutines. I’ve came up with two interesting ones:
Again, try it yourself before continuing.
At 0x004099d1 there is a call to a stack variable. If we put a breakpoint there, we will soon see a call to VirtualAlloc. Step over and follow eax on dump 1. After that call, it makes a call to sub_406e40, which, at 00406f97, makes another call to eax. Placing a breakpoint on that address will reveal us another call to VirtualAlloc. Again, step over and follow eax on dump 2.
This is a very manual process, the reader will need to deep dive on those routines and really pay attention to get anything valuable from them.
Finally, at 00409d90, there is a call to another stack value. Placing a breakpoint on it and stepping into will reveal a PE file on dump 2. Dump it, but soon you will notice that it isn’t our unpacked binary. That call (at 00409d90) is made to the previous allocated memory (dump 1). Knowing that, dump the content from dump 1 and open in your disassembler.
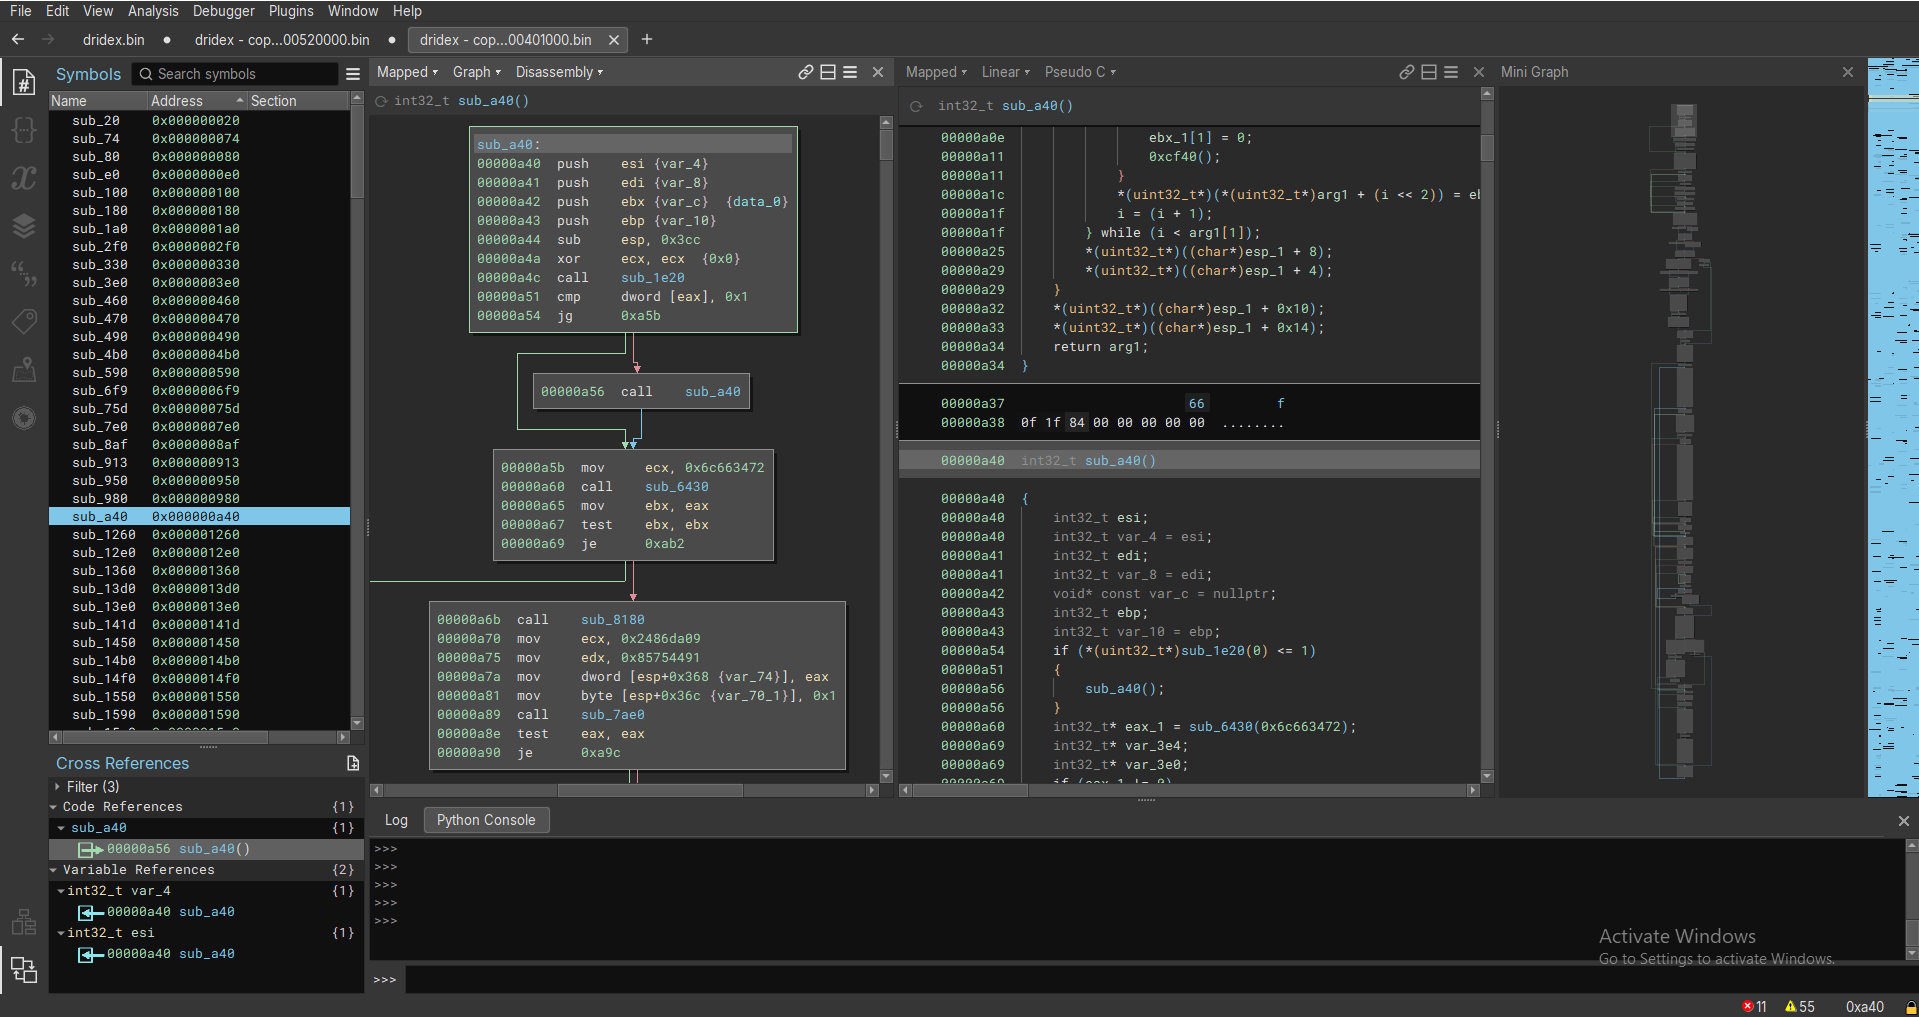
As it starts the execution at the base address which was allocated (00520000 in my case), we can assume that sub_0 in the disassembler is our entrypoint.
This shellcode is huge. There are plenty of indirect calls which the reader can find them by itself as an exercise.
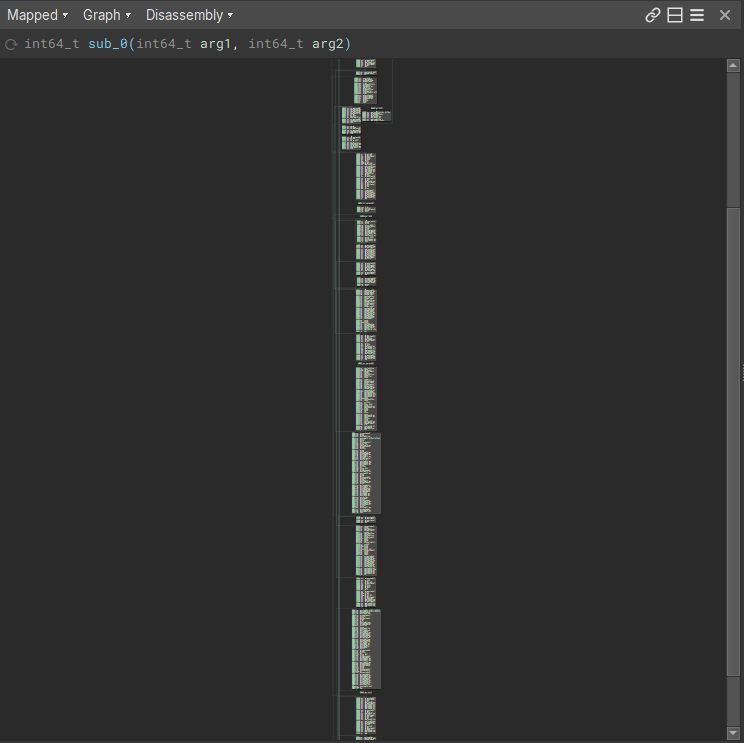
Going by the principle that most of it is related to the unpacking code, at the end of this subroutine there is a jump to rax. Calculate the offset and place a breakpoint on it. Hitting that address, you will see the address 0x00401a40.
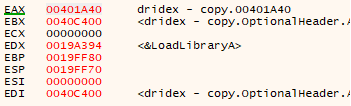
As the reader must have noticed, it is the address of our original .text, meaning that our unpacking procedure is a .text replacement!
Dump the .text segment from memory, open it on your disassembler, and you successfully unpacked the binary!
In this particular case, dumping only the .text from memory was better than dumping the whole PE. It may vary for the reader.
To get to the shellcode’s entrypoint, remember that it is set by its caller, so the offset a40 is our entrypoint:
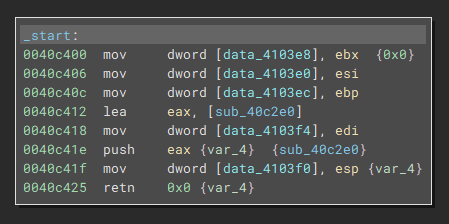
That whole process summed up to the following:
start:
0040c412 lea eax, [sub_40c2e0]
0040c41e push eax
0040c425 ret

0040c2e0 sub_40c2e0:
0040c3d8 call sub_40b4c0
	0040b4c0 sub_40b4c0:
	0040b658 mov dword [data_411bf4], eax ([data_411bf4] = sub_40afe0)
0040c3f4 call [data_411bf4] = (sub_40afe0)

0040afe0 sub_40afe0:
0040b4b4 call sub_409820

00409820 sub_409820:
004099d1 call dword [esp+0x54] (VirtualAlloc)
004099fb call sub_406e40
	00406e40 sub_406e40:
	00406f97 call eax (VirtualAlloc)
00409d90 call dword [esp+0x220] (shellcode at 00450000)

shellcode:
00000273 (00450273) call rdx (VirtualProtect/VirtualAlloc several times)
00000e0b (00450e0b) call qword [rsp+0x14]
00000f58 (00450f58) jmp rax (replaced .text at 00401a40)

dump!
Now, feel free to apply the knowledge you gathered here on this binary.
And that’s how i usually deal with custom packers. Although it is a pretty manual task, keep going, it is very rewarding to get the unpacked code by manually unpacking it.
Thank you for your time, see you on the next one. Thanks for reading!